|
HyperPlot
v1
Bin and visualise multidimensional datasets
|
HyperPlot, Author: Sam Harnew, sam.harnew@gmail.com , Date: Dec 2015
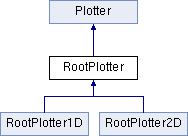
Class to make plotting root histograms a little easier.
Definition at line 23 of file RootPlotter.h.
#include <RootPlotter.h>
Public Member Functions | |
| void | setXaxisName (TString name) |
| void | setYaxisName (TString name) |
| virtual double | getGlobalMax () |
| virtual double | getGlobalMin () |
| RootPlotter (TH1 *histogram, double width=300, double height=200) | |
| TString & | drawOptions (int i) |
| TString & | objDrawOptions (int i) |
| void | plotStacked (TPad *pad, double scaleFactor) |
| void | plotSame (TPad *pad, TString plotOptions, double scaleFactor=1.0) |
| virtual void | plot (TString plotDirectory, TString plotOptions="", TPad *pad=0, double scaleFactor=1.0) |
| void | addText (TString text, double x, double y, int alignh=1, int alignv=2, double size=0.06, int ndc=true) |
| void | drawLegend () |
| virtual | ~RootPlotter () |
 Public Member Functions inherited from Plotter Public Member Functions inherited from Plotter | |
| int | getColor (int i) |
| void | setColor (int i, int color) |
| void | usePresetColours (bool val=true) |
| void | allImageFormats (bool val=true) |
| void | setHistogramOwnership (bool i=1) |
| void | setObjectOwnership (bool i=1) |
| Plotter (TString canvasName, double width, double height) | |
| Plotter (const Plotter &other) | |
| void | add (TObject *histogram) |
| void | addDot (double xpos, double ypos, double size, int colour=1, TString shape="circle", double sizeY=0.0) |
| void | logX (bool log=1) |
| void | logY (bool log=1) |
| void | logZ (bool log=1) |
| void | addObject (TObject *obj) |
| int | getNumObjects () |
| void | setImageFormat (TString format) |
| TPad * | getCanvas () |
| void | scaleTextSize (double scale) |
| void | scaleAxisTitleSize (double scale) |
| void | scaleAxisTitleOffset (double scale) |
| void | setXAxisLabelSize (double val) |
| void | setYAxisLabelSize (double val) |
| void | setXAxisTitleSize (double val) |
| void | setYAxisTitleSize (double val) |
| void | setXAxisLabelOffset (double val) |
| void | setYAxisLabelOffset (double val) |
| void | setXAxisTitleOffset (double val) |
| void | setYAxisTitleOffset (double val) |
| void | setXAxisTickLength (double val) |
| void | setYAxisTickLength (double val) |
| void | setPropertiesFromTH1 (TH1 *hist) |
| void | setMin (double min) |
| void | setMax (double max) |
| void | setBMargin (double val) |
| void | setLMargin (double val) |
| void | setRMargin (double val) |
| void | setTMargin (double val) |
Protected Member Functions | |
| virtual void | setHistogramStyle (TH1 *histogram, bool setMinMax=1)=0 |
| TH1 * | getHistogram (int i) |
| Protected Member Functions inherited from Plotter | |
| virtual void | setCanvasDefaults (TPad *pad) |
Protected Attributes | |
| TString | _xAxisName |
| TString | _yAxisName |
| std::vector< TString > | _drawOptions |
| std::vector< TString > | _objDrawOptions |
| Protected Attributes inherited from Plotter | |
| TPad * | _canvas |
| TLegend * | _legend |
| double | _forcedMax |
| double | _forcedMin |
| std::vector< TObject * > | _objToPlot |
| std::vector< TObject * > | _histograms |
| std::vector< int > | _colours |
| double | _lMargin |
| double | _rMargin |
| double | _tMargin |
| double | _bMargin |
| double | _xAxisTitleOffset |
| double | _yAxisTitleOffset |
| double | _xAxisLabelOffset |
| double | _yAxisLabelOffset |
| double | _xAxisTickLength |
| double | _yAxisTickLength |
| double | _xAxisLabelSize |
| double | _yAxisLabelSize |
| double | _xAxisTitleSize |
| double | _yAxisTitleSize |
| bool | _histogramOwnership |
| bool | _objectOwnership |
| bool | _usePresetColours |
| bool | _allImageFormats |
Additional Inherited Members | |
| Static Public Attributes inherited from Plotter | |
| static TString | s_imageformat = ".pdf" |
| static TString | s_imageformat2 = "" |
| static TString | s_legend_position = "RightTop" |
| static int | s_plotterCount = 0 |
| static double | s_forcedMax = -999.999 |
| static double | s_forcedMin = -999.999 |
| RootPlotter::RootPlotter | ( | TH1 * | histogram, |
| double | width = 300, |
||
| double | height = 200 |
||
| ) |
Construct a RootPlotter with one histogram on a canvas with specified width and height
Definition at line 4 of file RootPlotter.cpp.
|
virtual |
Destructor.
Definition at line 209 of file RootPlotter.cpp.
| void RootPlotter::addText | ( | TString | text, |
| double | x, | ||
| double | y, | ||
| int | alignh = 1, |
||
| int | alignv = 2, |
||
| double | size = 0.06, |
||
| int | ndc = true |
||
| ) |
Add a text string at a point (x,y) on the histogram
Definition at line 33 of file RootPlotter.cpp.
| void RootPlotter::drawLegend | ( | ) |
Add a legend to the Canvas - not really tested
Definition at line 48 of file RootPlotter.cpp.
| TString & RootPlotter::drawOptions | ( | int | i | ) |
Get a reference to the draw options of histogram i - used for getting and setting
Definition at line 21 of file RootPlotter.cpp.
|
inlinevirtual |
Get the minimum of all histograms added (or the forced min if set)
Reimplemented in RootPlotter1D, and RootPlotter2D.
Definition at line 44 of file RootPlotter.h.
|
inlinevirtual |
Get the maximum of all histograms added (or the forced max if set)
Reimplemented in RootPlotter1D, and RootPlotter2D.
Definition at line 45 of file RootPlotter.h.
|
protected |
Get one of the histograms that has been added to the plotter
Definition at line 16 of file RootPlotter.cpp.
| TString & RootPlotter::objDrawOptions | ( | int | i | ) |
Get a reference to the draw options of object i - used for getting and setting
Definition at line 27 of file RootPlotter.cpp.
|
virtual |
Call this to save the canvas to a specific directory.
Implements Plotter.
Definition at line 183 of file RootPlotter.cpp.
| void RootPlotter::plotSame | ( | TPad * | pad, |
| TString | plotOptions, | ||
| double | scaleFactor = 1.0 |
||
| ) |
plot with the option SAME
Definition at line 124 of file RootPlotter.cpp.
| void RootPlotter::plotStacked | ( | TPad * | pad, |
| double | scaleFactor | ||
| ) |
plot stacked
Definition at line 73 of file RootPlotter.cpp.
|
protectedpure virtual |
purely virtual function that sets the correct histogram style (different for TH1 and TH2)
Implemented in RootPlotter1D, and RootPlotter2D.
|
inline |
Set the x-axis title name
Definition at line 41 of file RootPlotter.h.
|
inline |
Set the y-axis title name
Definition at line 42 of file RootPlotter.h.
|
protected |
options passed to Root on how to draw each histogram added
Definition at line 30 of file RootPlotter.h.
|
protected |
options passed to Root on how to draw each object added
Definition at line 31 of file RootPlotter.h.
|
protected |
xAxis name - by default taken from the first histogram added
Definition at line 27 of file RootPlotter.h.
|
protected |
yAxis name - by default taken from the first histogram added
Definition at line 28 of file RootPlotter.h.
 1.8.10

